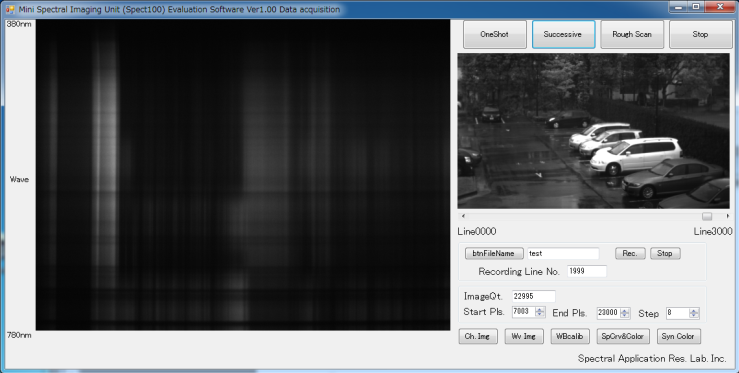
Sample software screen image

Screen image for continuous measurements


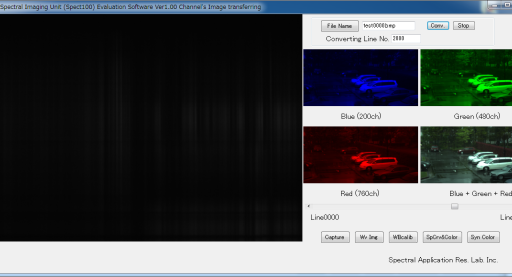
Convert the images per wavelength
Composite the images for 3 channels; typically 200, 480 and 760Ch (approx. 456, 575 and 694nm respectively) by assigning them to B, G and R, and convert them into data per 5nm, 10nm and 20nm in the range of 380-780nm.
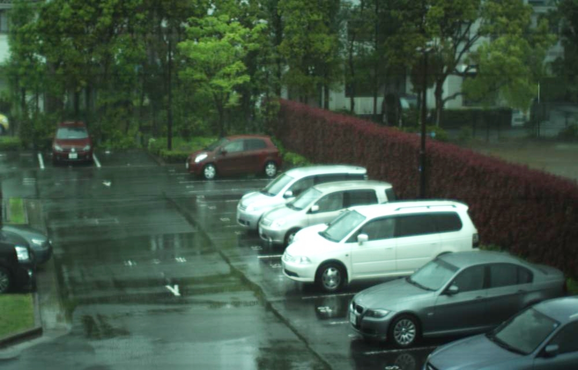
Measurement sample by Spect CAM-100vis
Gamma corection is added to the above composite image. Basic setting is linear measurement and linear display, however, in order to approximate the actual view, the image is displayed with increased center brightness (approx. 1.6)
Measurement & Analysis details
- Hyper Spectral Imaging measurement in the range of 380-780nm (Standard: 1600x1280 pixels* (No. of wavelength: 960Ch)) (Measurable up to 2560x1280 pixels)
- Convert to image files per channel or wavelength: 380-780nm (per 5nm), 380-780nm (per 10nm), 400-700nm (per 20nm), etc.
- Convert to reflectance image using black/white reference plate
- Spectral display of interested region (designated with ROI)
- Color value calculation after two-dimensional measurement (Standard lights A, C, D65 and other arbitrary light source), XYZ, CIELab, etc.
- Color composition by color-matching function SRGB, XYZ and your original function.
- Others, quantitative calculation, etc. (option)
